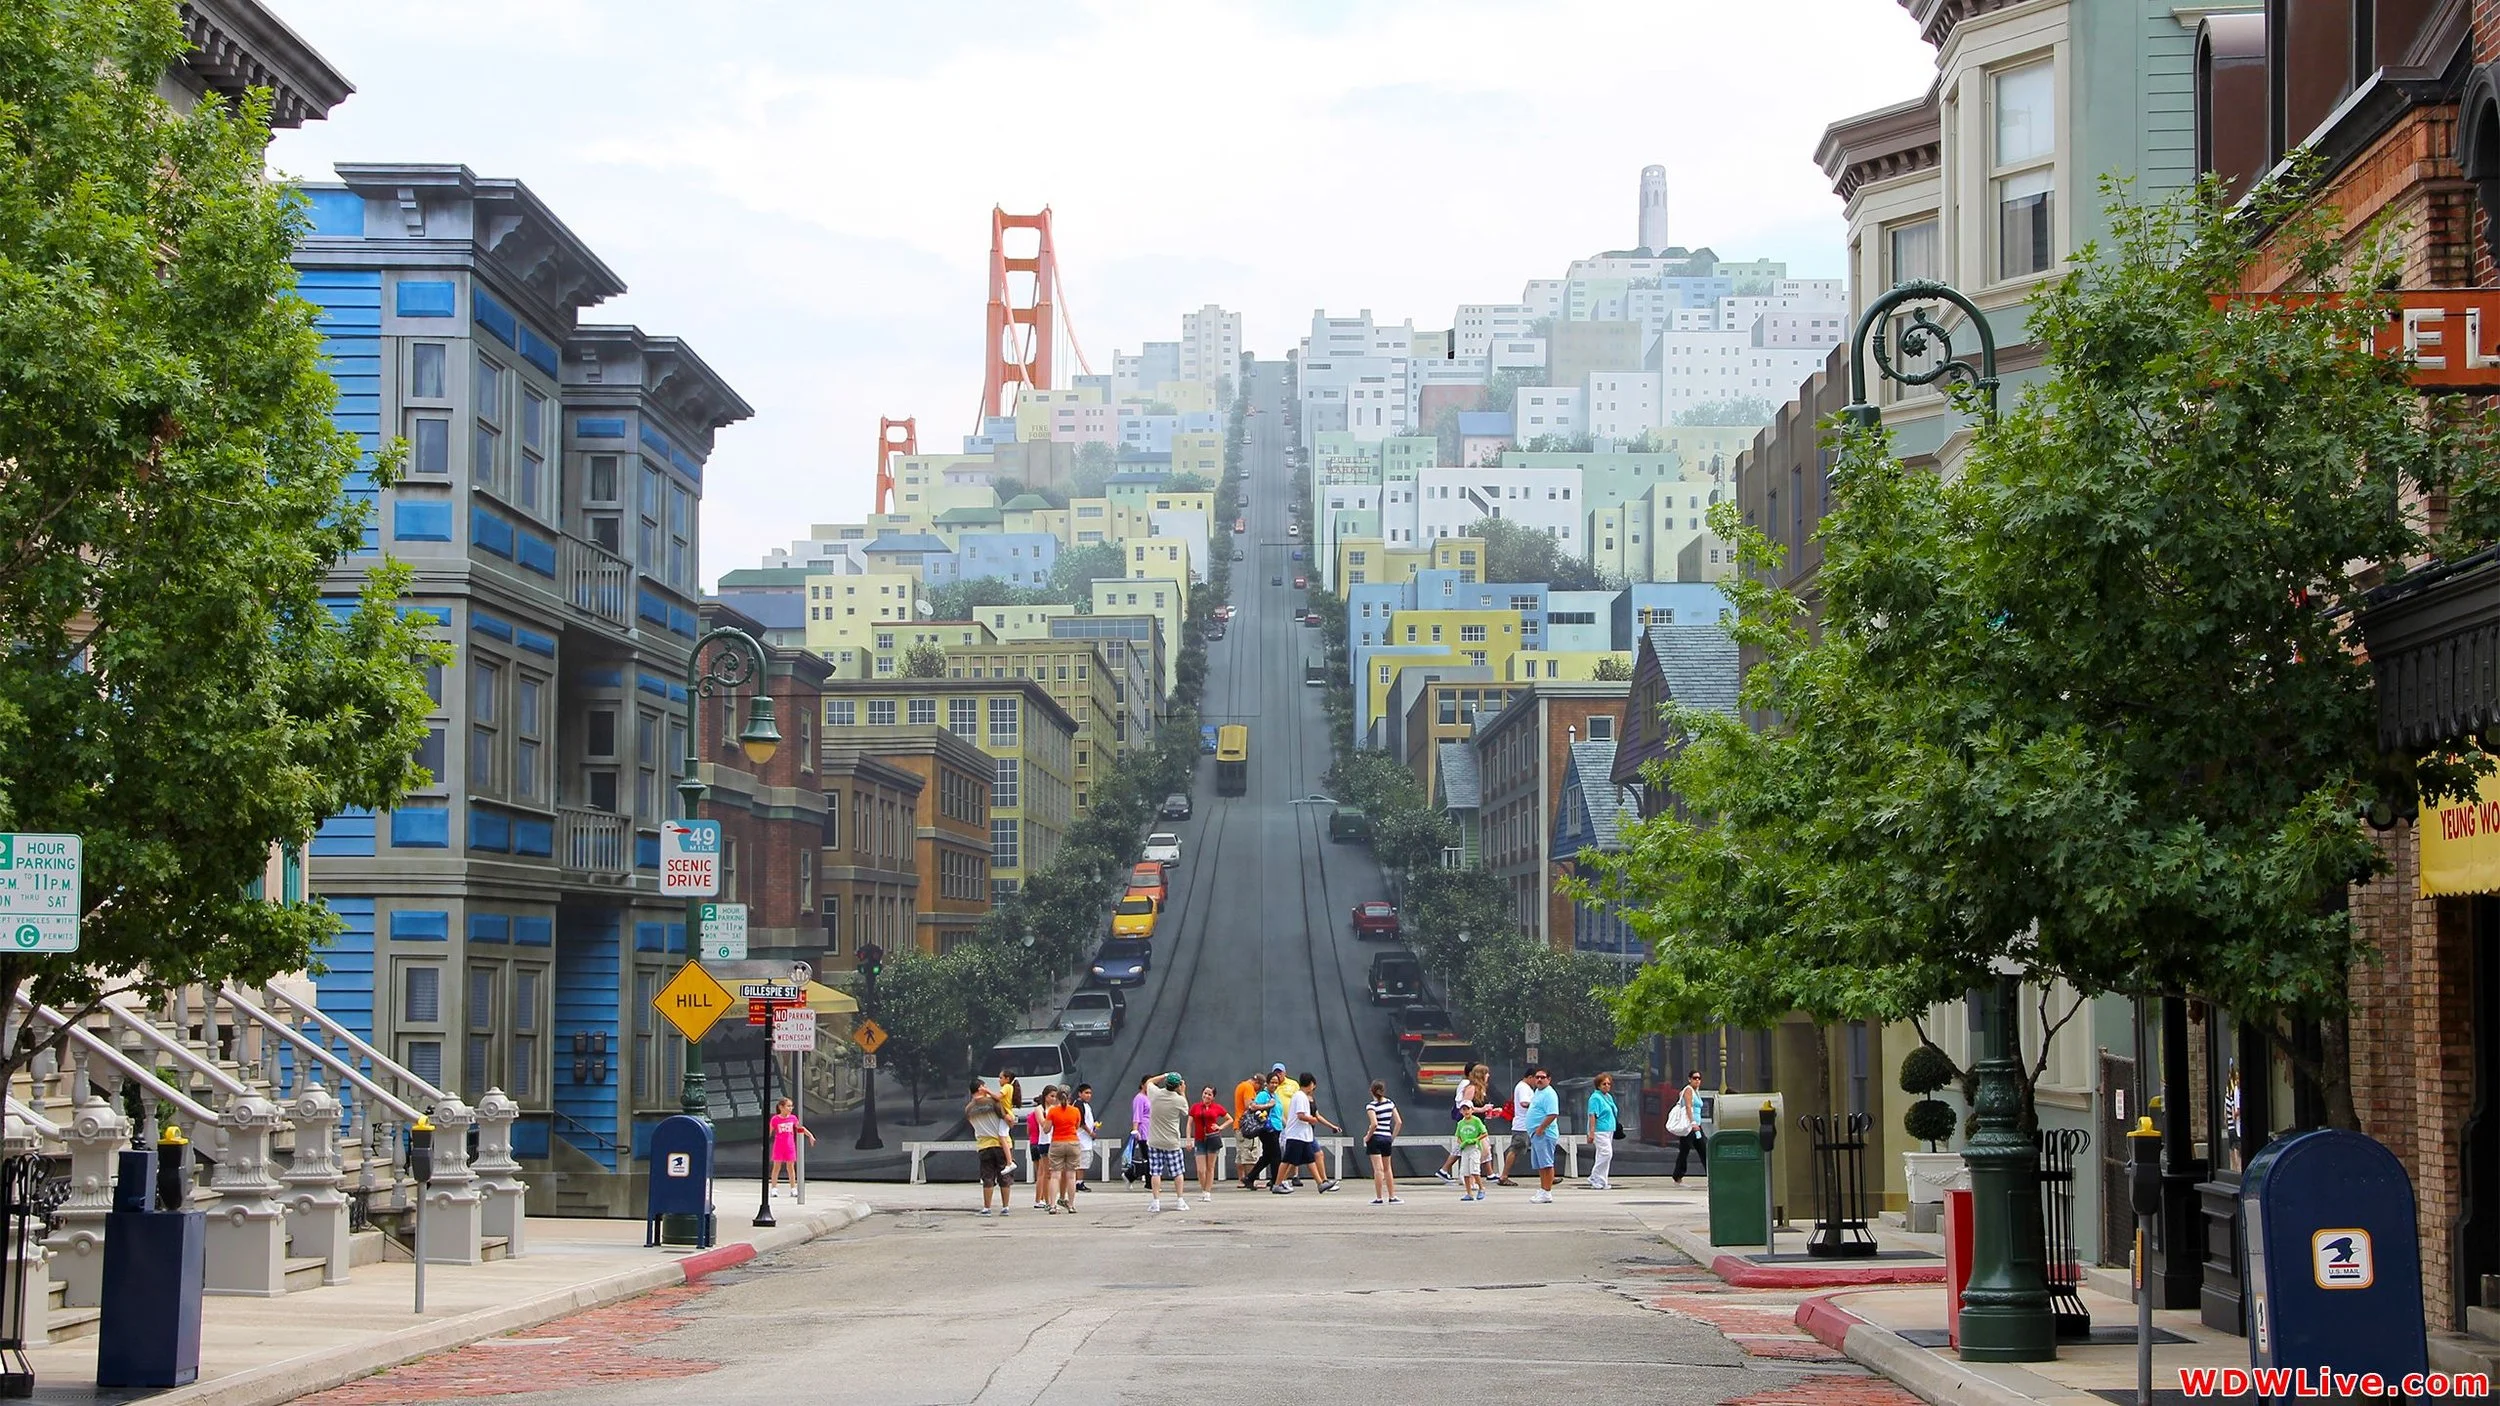
San Francisco Speed Epidemic
Role: GIS Analyst
Context: Project
Period: Fall 2021
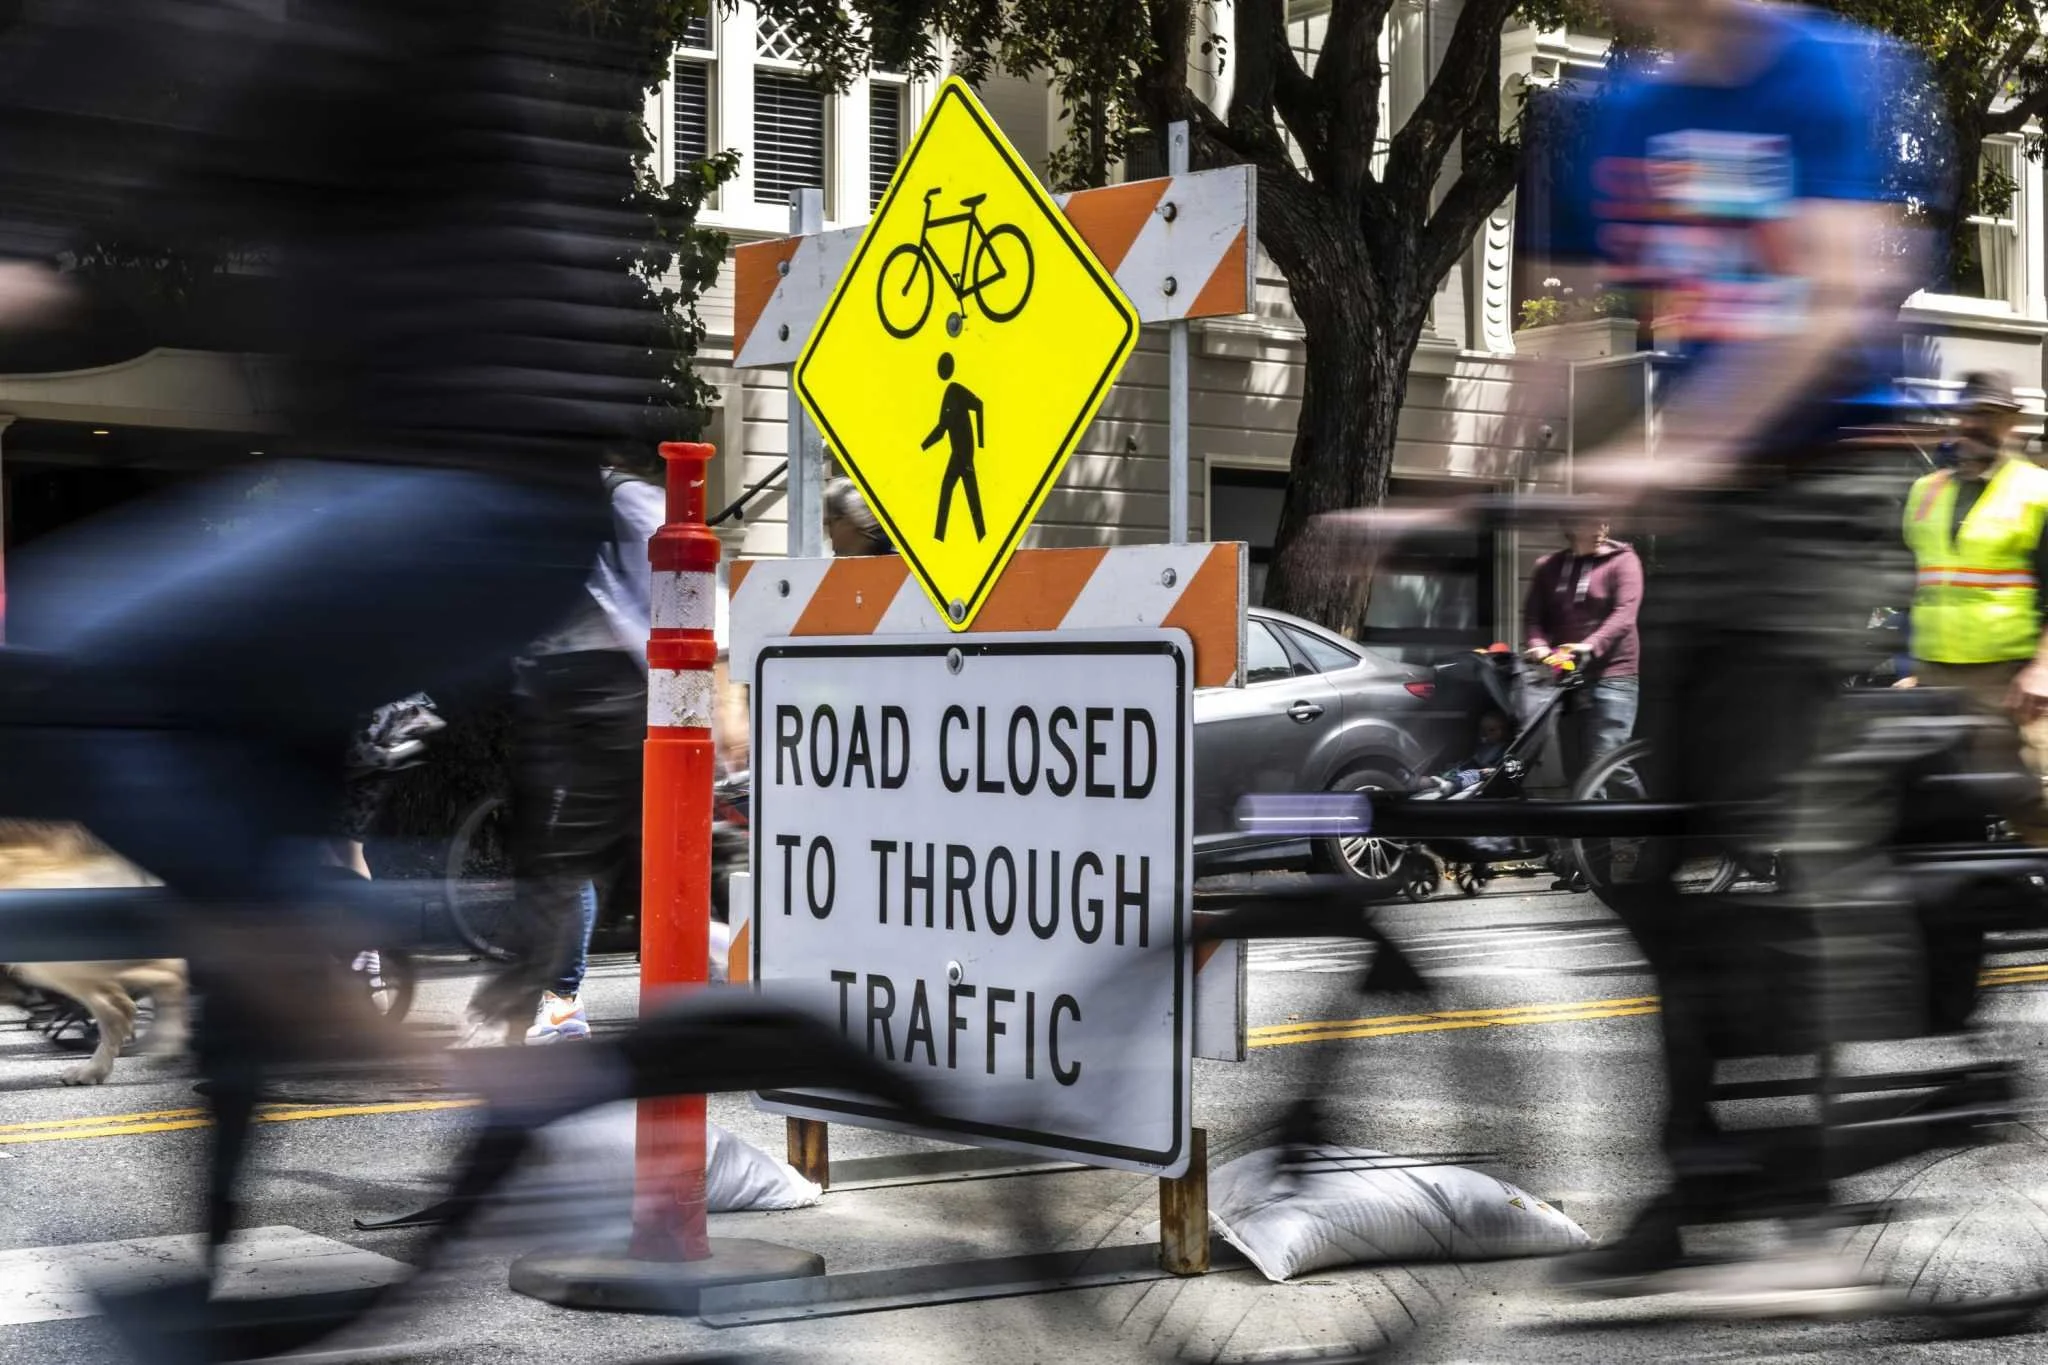
An Obstacle to Vision ZeroYellow Light
An observation of how high-speed limits correlate with preventable traffic related deaths in the streets of San Francisco. Cars have not only been a main contributor to the Earth’s carbon footprint, but they tend to be the main suspect or perpetrator of street related fatalities. While the fact that the US’s autocentric nature cannot be changed in an instant, certain steps can be taken, and aspects be changed to reduce the number of deaths.
slow down
ANALYSIS & RESEARCH Speed Limits
A review of fatalities
One of the most notable features of the recorded traffic deaths would be the lack of a dip, in which even with the advancements in technology and safety standards, the number of deaths remained stagnant throughout the years. Taking notice of this, I reviewed and plotted 2020 traffic deaths on a speed limit map, from SF’s GIS database. The overlap was evident, traffic deaths mainly occurred on streets with a 25 mph or above speed limit. In addition to the prior, when streets with 25 mph or greater speed limits were placed atop of the high injury network, another overlap was evident.